

BoosterHand Lab · simulation
I Dropped 1,000,000 Plinko Balls: Plinko Odds, RTP and Risk Levels Simulated
Updated 2026-11-03 · By BoosterHand Lab · Method: Monte Carlo simulation (Python/NumPy, fixed seed)

- On a 16-row board with 50/50 bounces, each edge slot is 1 in 65,536. Either edge: 1 in 32,768 balls on average.
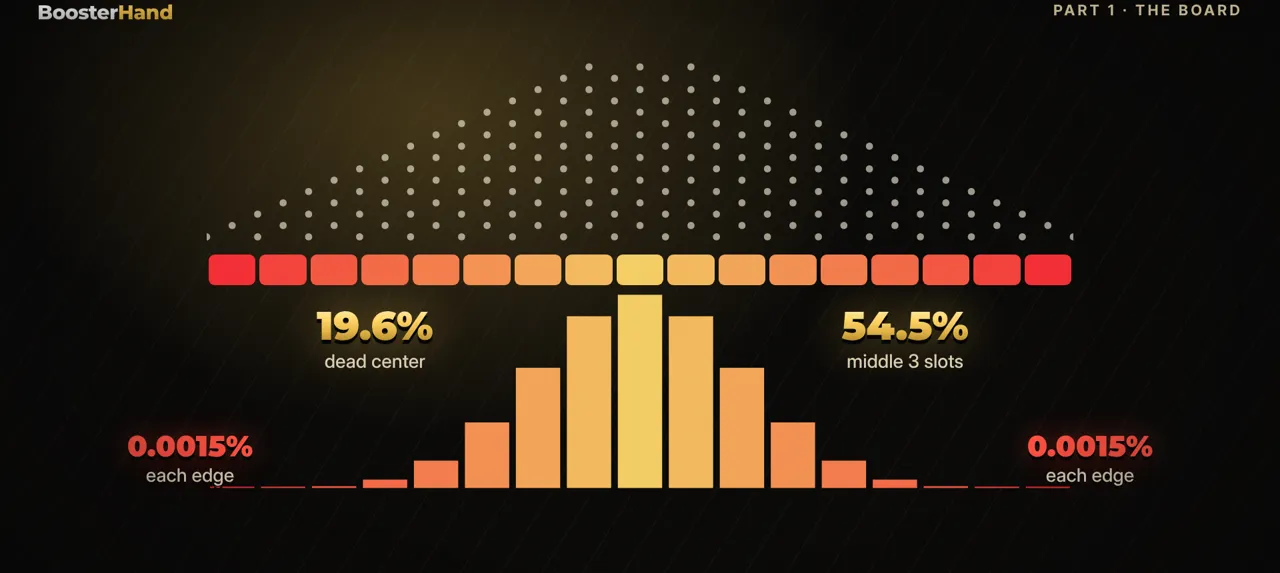
- 54.5% of balls land in the middle 3 slots. On high risk, 79% of balls land in a 0.2x slot.
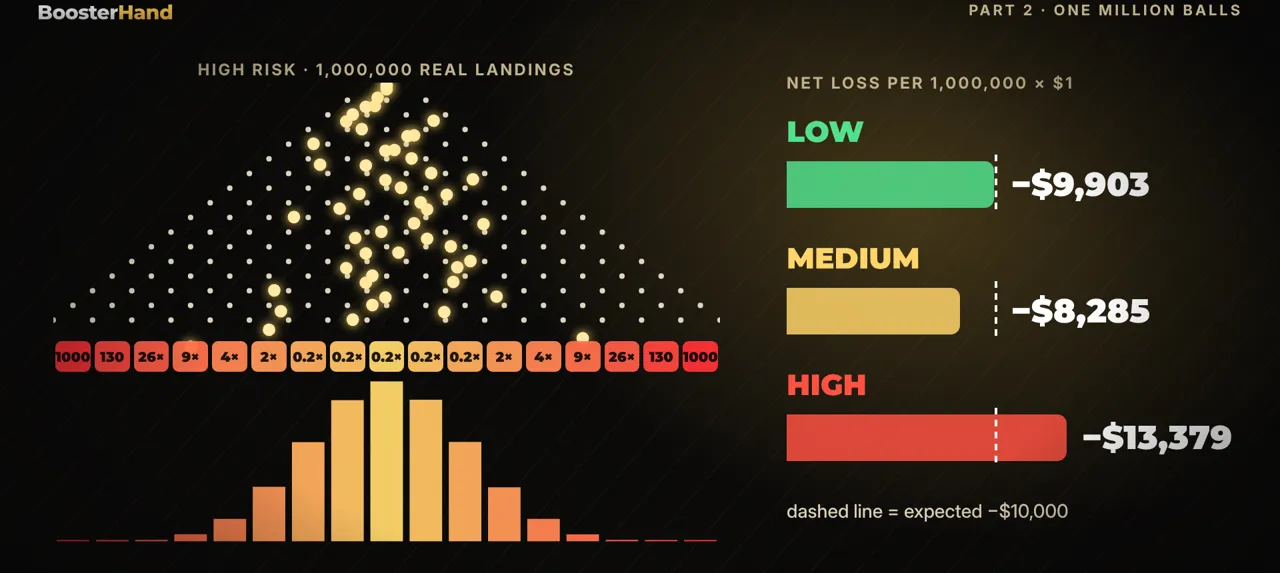
- All three payout tables return about 99%. Over 1,000,000 $1 balls the board kept $9,903 (low), $8,285 (medium) and $13,379 (high).
- The 1,000x slot hit 28 times in a million balls (math expects ~30.5), and the high-risk board still won.
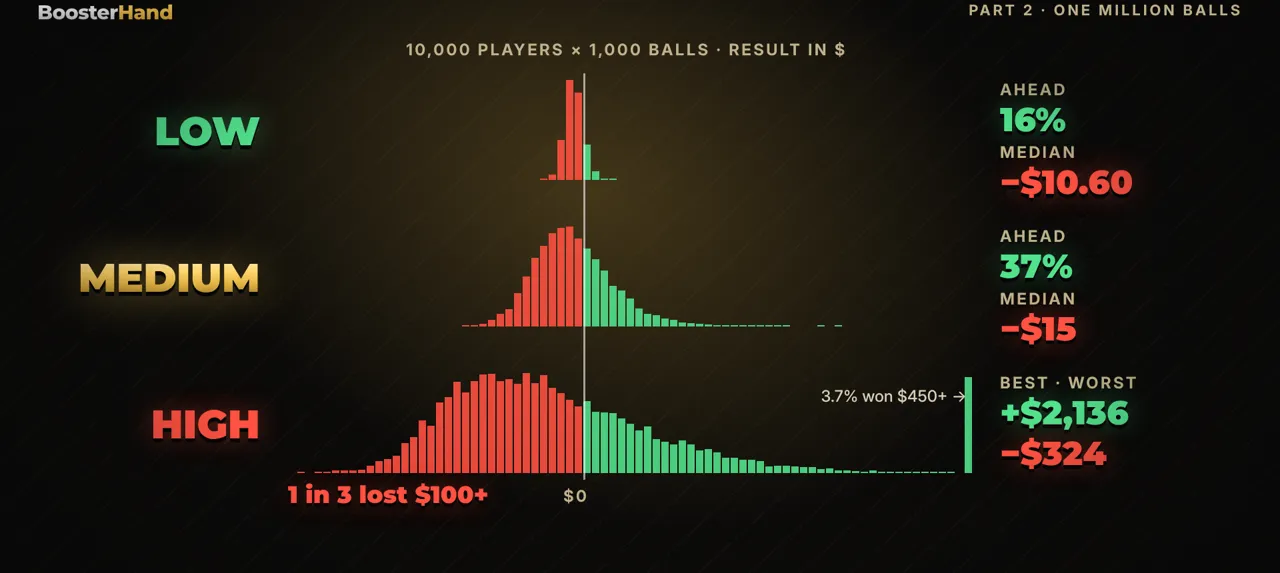
- 10,000 players × 1,000 balls: on high risk 35% ended ahead, but the median player lost $49.80 and 1 in 3 lost $100 or more.
A Plinko board shows you a 1,000x slot on each edge and makes it look reachable. I dropped 1,000,000 simulated balls on each of three risk levels to see how often the edge actually pays, where the balls really land and how much the board keeps over time.
Short answer: the 1,000x slot is real, but it’s 1 in 32,768, and the board wins anyway.
How a Plinko board works
Our board has 16 rows of pegs. At every peg the ball bounces left or right with a 50/50 chance. After 16 bounces it lands in one of 17 slots, and each slot pays a multiplier of your bet.
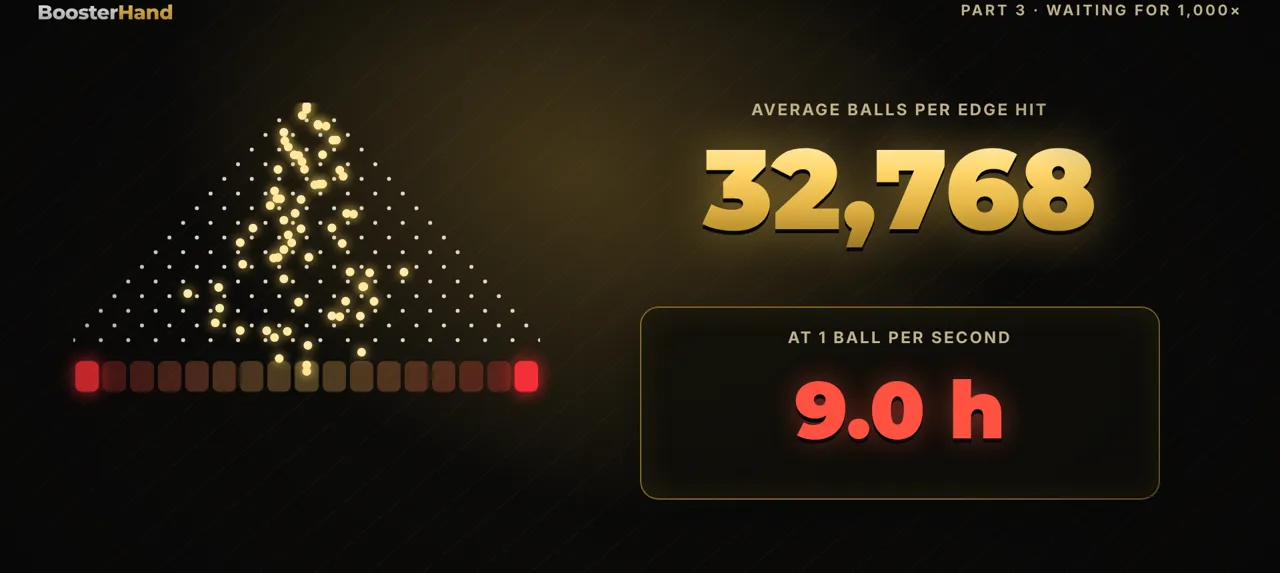
To reach an edge slot, the ball has to go the same way 16 times in a row. That’s 1 in 2^16 = 1 in 65,536 for each edge, or 2 in 65,536 = 1 in 32,768 for either edge.
Most balls do something much more boring. The number of paths to each slot follows a binomial distribution, the same bell shape you see on a Galton board:
| Slot (from centre) | Chance per ball |
|---|---|
| Centre slot | 19.6% |
| Middle 3 slots | 54.5% |
| Each edge slot | 0.0015% |
Three risk levels, the same 99% RTP
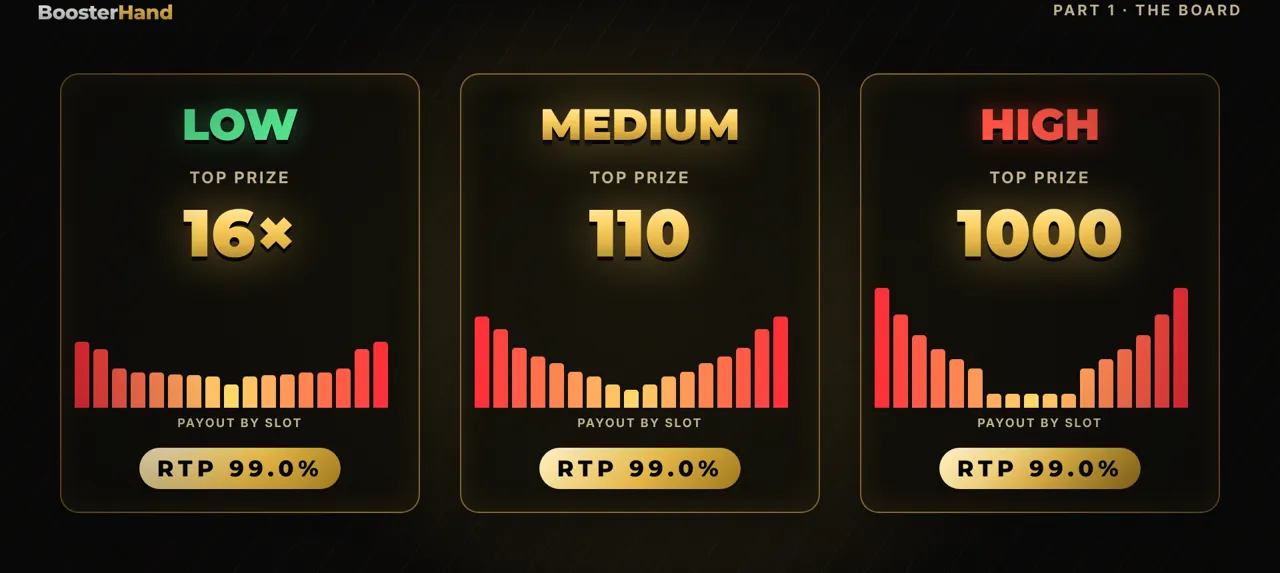
Plinko games usually let you pick a risk level. I designed three payout tables for this test (generic, not copied from any game). Each one returns about 99% of every dollar bet:
| Risk | Edge → centre multipliers | Exact RTP |
|---|---|---|
| Low | 16x, 9x, 2x, 1.4x, 1.4x, 1.2x, 1.1x, 1x, 0.5x | 98.999% |
| Medium | 110x, 41x, 10x, 5x, 3x, 1.5x, 1x, 0.5x, 0.3x | 98.988% |
| High | 1,000x, 130x, 26x, 9x, 4x, 2x, 0.2x, 0.2x, 0.2x | 98.977% |
The trick is in the middle. On high risk, the five centre slots pay 0.2x, and 79% of balls land there. Every big edge multiplier is paid for by those small losses in the middle.
Before the results: which risk level leaves the typical player worst off after 1,000 balls? Make your guess, then read on.
How we ran the simulation
- Board: 16 rows, 50/50 bounce at every peg, 17 slots
- Payout tables: the three above, each ~99% RTP
- Test 1: 1,000,000 balls per risk level at a flat $1 bet
- Test 2: 10,000 players per risk level, 1,000 balls each at $1
- Method: Monte Carlo simulation in Python (NumPy), fixed random seed for reproducibility
1,000,000 balls: the results
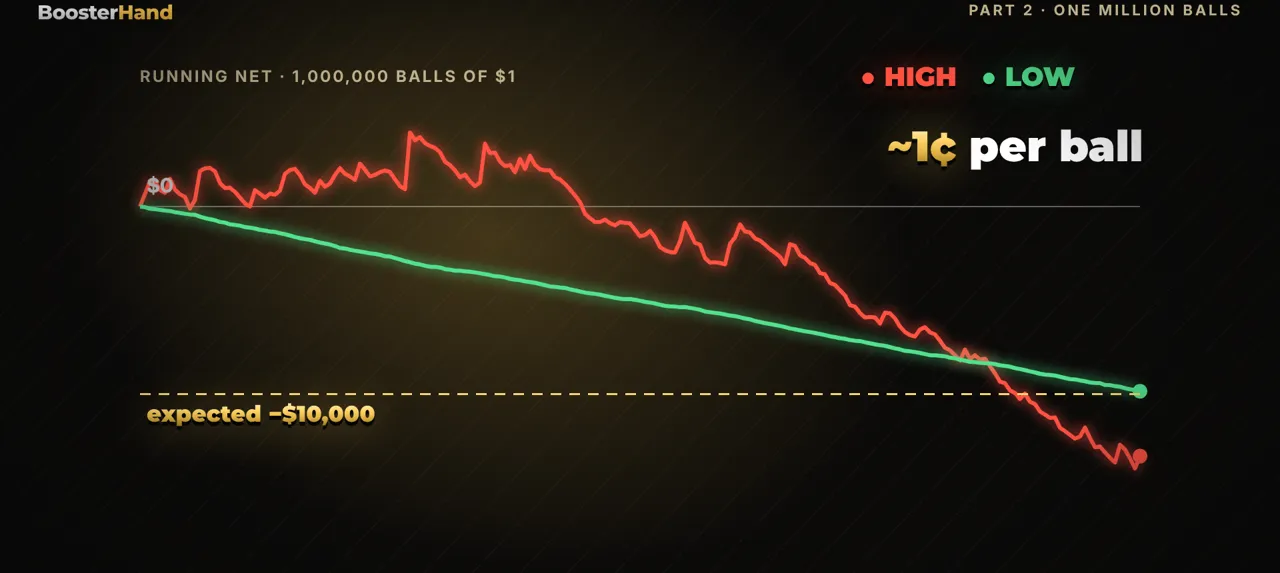
With a 1% edge, the expected loss on $1,000,000 wagered is about $10,000. Here’s what the simulation produced:
| Risk | Returned | Net result | Simulated RTP | Edge-slot hits |
|---|---|---|---|---|
| Low | $990,097 | −$9,903 | 99.01% | 22 (16x) |
| Medium | $991,716 | −$8,285 | 99.17% | 47 (110x) |
| High | $986,621 | −$13,379 | 98.66% | 28 (1,000x) |
On high risk the 1,000x slot hit 28 times, close to the ~30.5 the math predicts. That’s $28,000 in edge payouts, and the board still kept $13,379.
The running total shows why. On low risk, the balance slides down almost in a straight line. On high risk, it jumps up with every rare hit and then grinds back down, but it follows the same downward slope: about 1 cent lost per $1 ball.
10,000 players: who ends up ahead?
A million balls is the casino’s view. A real session is much shorter, so I gave 10,000 simulated players 1,000 balls each at $1.
| Risk | Ended ahead | Median result | Worst | Best | Lost $100+ |
|---|---|---|---|---|---|
| Low | 16% | −$10.60 | −$47.50 | +$38.70 | 0% |
| Medium | 37% | −$15.00 | −$131.00 | +$295.50 | 1% |
| High | 35% | −$49.80 | −$324.40 | +$2,135.80 | 32% |
High risk has the most dramatic winners: the best player finished +$2,136. But the typical high-risk player lost $49.80, almost 5 times more than on low risk, and 1 in 3 lost $100 or more. Same 99% RTP on every board, very different pain.
This is the same pattern we saw in our slot volatility simulation: risk level changes the shape of your results, not the house edge.
Waiting for 1,000x
On average you need 32,768 balls to hit an edge slot once. At one ball per second, that’s more than 9 hours of nonstop dropping, and at $1 per ball the 1% edge costs about $328 along the way. Among our 10,000 high-risk players, only 3.6% saw the 1,000x slot even once in 1,000 balls.
Limits of this model
Our board is a clean model: 16 rows, perfectly fair 50/50 bounces and payout tables built for this test. Real games offer different row counts (often 8 to 16), different tables and their own RTP figures. The binomial maths is the same on any fair board, but check the game’s info screen for the exact table and RTP. If the game is provably fair, you can verify each result yourself.
What this means for you
- Same edge on every risk level. All three boards kept about 1 cent per $1. No risk setting, row count or bet size changes that.
- Higher risk means bigger swings, not better odds. The median high-risk player lost almost 5 times more than the median low-risk player over the same 1,000 balls.
- Budget as if you’ll never see the edge. It’s 1 in 32,768 per ball. If a session only works out when the 1,000x lands, it usually won’t work out.
Plinko is a game of chance with the edge built into the payout table. Set a budget you can afford to lose, and stop when it’s gone. If gambling stops being fun, our responsible gambling page has tools and support.
Did you guess the right risk level? And if you want to see how a 1% edge compares with a slot machine, read what happened over 1 million slot spins.
FAQ
What are the odds of hitting the edge slot in Plinko?
On a 16-row board where every bounce is 50/50, the ball must go the same way 16 times in a row. That is 1 in 65,536 for each edge, or 1 in 32,768 for either edge. Boards with fewer rows have better edge odds but smaller top multipliers.
What is the RTP of Plinko?
It depends on the payout table the game uses. The three tables in our simulation were designed to return about 99%, a common figure for crypto-style Plinko games. Always check the RTP shown in the game's info screen, because it can differ.
Is high risk or low risk Plinko better?
Neither changes the house edge: all three of our tables kept about 1 cent per $1. High risk just makes the swings bigger. Over 1,000 balls, the median high-risk player lost $49.80 against $10.60 on low risk.
Is there a Plinko strategy that works?
No. Each ball is independent and the payout table already has the edge built in. Changing the risk level, number of rows or bet size changes the volatility, not the expected loss per dollar.
Is Plinko rigged?
A fair Plinko board doesn't need to be rigged: the payout table guarantees the house keeps about 1% over time. On provably fair games you can verify each drop yourself; see our provably fair explainer.
Related
Simulations use generic models, not any real game or casino. Results show long-run math, not predictions for one session. 18+ only. If gambling stops being fun, take a break: responsible gambling.
Sources
- Galton board — Wikipedia
- Binomial distribution — Wikipedia
- Monte Carlo method — Wikipedia
- Expected value — Wikipedia
Next experiment: Mines Strategy: The Math Behind Every Click (Odds, Multipliers, RTP)