

BoosterHand Lab · simulation
How Slot Machines Work: The Hidden Reel Strip (5 Billion Spins Tested)
Updated 2026-11-04 · By BoosterHand Lab · Method: Monte Carlo simulation (Python/NumPy, fixed seed)
- Our reel shows 22 stops, but the RNG picks from 128 hidden virtual stops. The jackpot gets 1 of them, the blanks next to it get 14 each.
- Three jackpots look like 1 in 10,648 (22³). On the hidden reels they are 1 in 2,097,152 (128³): 197 times rarer.
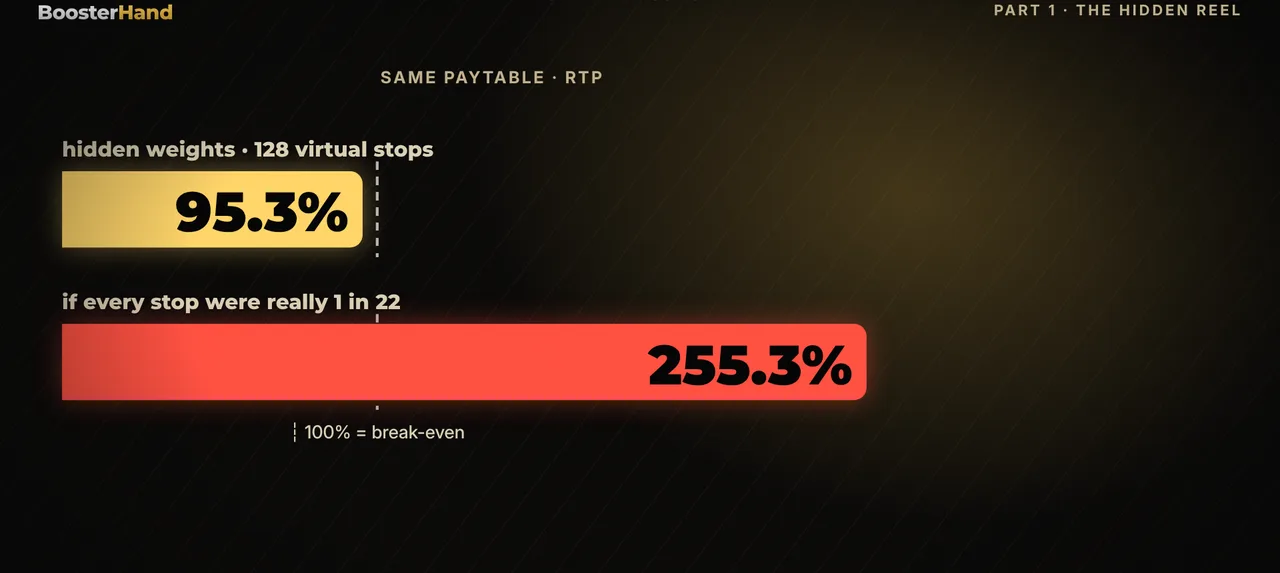
- Every payout × its exact chance adds up to an RTP of 95.3%. The same paytable on reels where every stop is really 1 in 22 would pay back 255.3%.
- Over 100,000,000 spins the next spin won 23.0% of the time overall, 23.0% after 10+ losses and 22.9% right after a 100x+ win. No hot or cold machines.
- In 5,000,000,000 spins the jackpot came about 1 in 2.1 million spins, whether the last one was minutes or 4 million spins ago. Nothing is ever due.
A slot reel looks honest. You can count the stops, see the jackpot symbol go by, and do the math in your head: one jackpot out of 22 stops, three reels, so three jackpots should be about 1 in 10,000. I built a generic 3-reel slot machine to test that, and the real odds came out at 1 in 2,097,152.
The reason is a second reel you never see. Then I spun the machine 5,000,000,000 times to test the other big slot myth: hot, cold and “due” machines.
How a slot machine really works
My machine has 3 reels and 1 payline. Each reel carries 22 physical stops: 11 symbols and 11 blanks. If every stop were equally likely, each would land 1 time in 22, about 4.5%.
But the random number generator (RNG) never picks a physical stop. It picks one of 128 virtual stops, and each virtual stop is mapped onto a physical one. Some physical stops get many virtual stops, some get only one:
| Stop on the reel | Virtual stops (of 128) | Chance per reel | Looks like |
|---|---|---|---|
| Jackpot symbol | 1 | 0.78% | 4.5% |
| Blank right above the jackpot | 14 | 10.9% | 4.5% |
| Blank right below the jackpot | 14 | 10.9% | 4.5% |
| Seven (each of 2) | 3 | 2.3% | 4.5% |
| Triple bar (each of 2) | 4 | 3.1% | 4.5% |
| Double bar (each of 2) | 5 | 3.9% | 4.5% |
| Single bar (each of 2) | 6 | 4.7% | 4.5% |
| Cherry (each of 2) | 5 | 3.9% | 4.5% |
| Other blanks (each of 9) | 5–6 | 3.9–4.7% | 4.5% |
In 1,000,000 simulated spins, the jackpot symbol landed on reel 1 0.78% of the time and the blank next to it 10.9%: exactly what the hidden weights say.
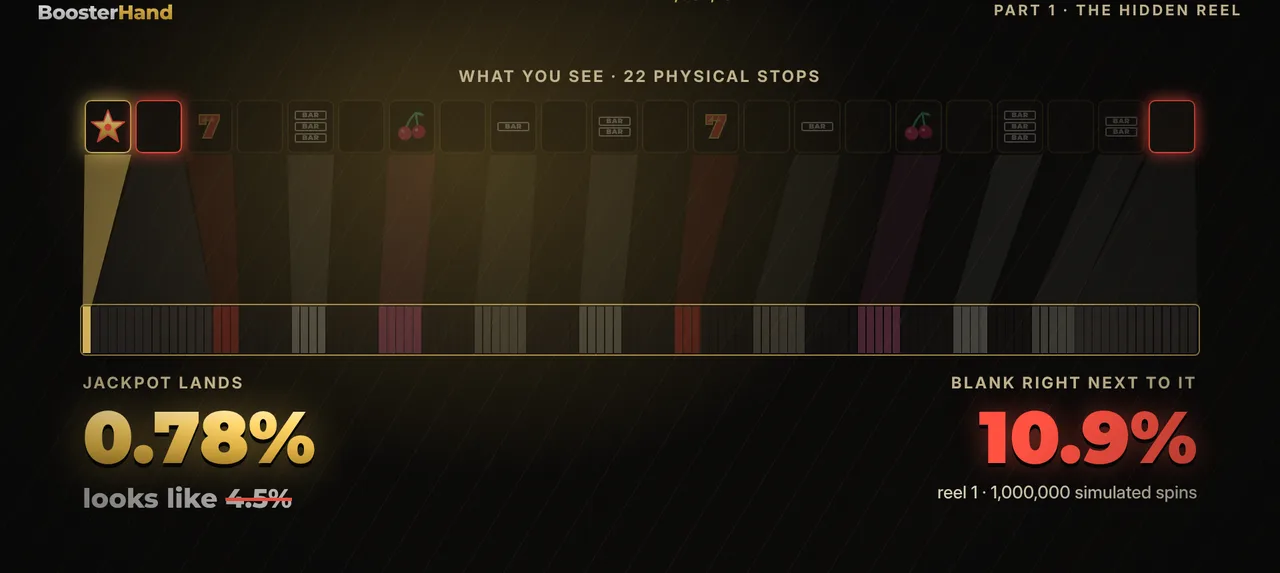
Each spin, the RNG picks a stop on every reel independently. The spinning animation is a show: the result is decided the moment the spin starts.
Slot machine jackpot odds: what you see vs the real odds
With the reels you see, three jackpots would be 1/22 × 1/22 × 1/22 = 1 in 10,648. With the hidden reels it is 1/128 × 1/128 × 1/128 = 1 in 2,097,152. That’s 197 times rarer, and nothing on the screen tells you.
How the RTP is set: the paytable
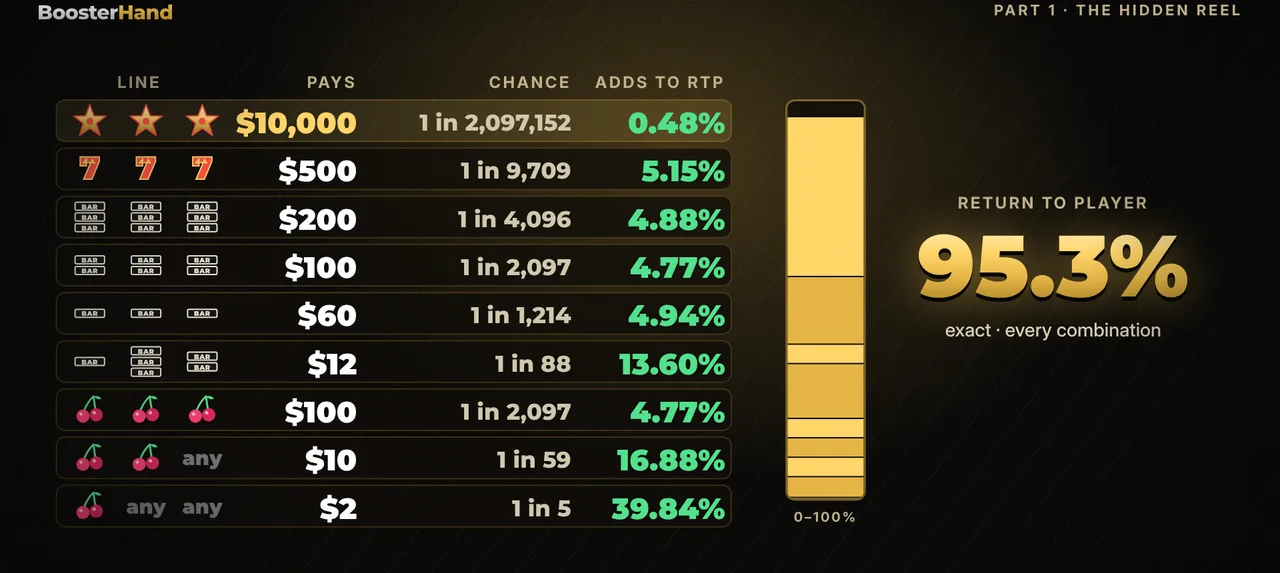
Here is the full paytable for a $1 bet. “Chance” is the exact probability per spin from the virtual reels, and “adds to RTP” is payout × chance:
| Line | Pays | Chance | Adds to RTP |
|---|---|---|---|
| 3 jackpots | $10,000 | 1 in 2,097,152 | 0.48% |
| 3 sevens | $500 | 1 in 9,709 | 5.15% |
| 3 triple bars | $200 | 1 in 4,096 | 4.88% |
| 3 double bars | $100 | 1 in 2,097 | 4.77% |
| 3 single bars | $60 | 1 in 1,214 | 4.94% |
| Any 3 bars (mixed) | $12 | 1 in 88 | 13.60% |
| 3 cherries | $100 | 1 in 2,097 | 4.77% |
| 2 cherries | $10 | 1 in 59 | 16.88% |
| 1 cherry | $2 | 1 in 5 | 39.84% |
| Total | 23.0% of spins win | 95.30% |
The RTP is 95.3%, fixed by the paytable and the hidden weights. Notice where it comes from: the single cherry pays back 39.84 cents of every dollar, while the famous jackpot adds only 0.48 cents.
Now the key question: what if the reels really were what they look like, with every stop 1 in 22? The same paytable would pay back 255.3%. The machine could not exist. That’s why the hidden reel exists: it lets a slot show big, frequent-looking symbols while paying out far less.
Before the results: after a long dry spell, do you think this machine is due? Right after a big win, does it go cold? Or does nothing change?
How we ran the simulation
- Machine: generic 3-reel, 1-line slot; 22 physical stops per reel mapped to 128 virtual stops (weights above); $1 per spin
- RNG: each spin picks a virtual stop on each reel independently and uniformly
- Test 1: 1,000,000 spins, then 100,000,000 spins to check the RTP
- Test 2 (hot/cold): in the 100,000,000 spins, the chance that the next spin wins after losing streaks of 5, 10, 20 and 30+ spins, and right after a win of 100x or more
- Test 3 (“due”): 5,000,000,000 spins, jackpot rate by spins since the last jackpot
- Test 4: 10,000 players × 1,000 spins of $1
- Method: exact probabilities over every reel combination plus Monte Carlo simulation in Python (NumPy), fixed random seed
1,000,000 and 100,000,000 spins
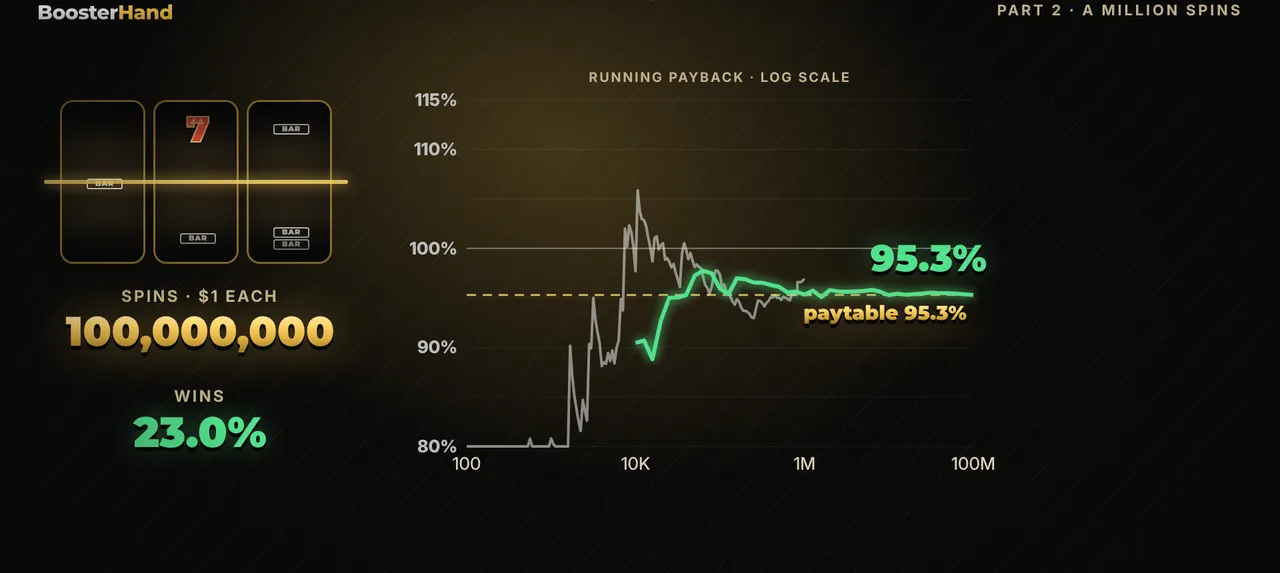
After 1,000,000 spins, 23.0% were wins and the machine paid back 96.9%, more than the math. The reason: one jackpot, on spin 825,763, worth $10,000. Without that one spin, the million spins paid back 95.9%.
| Spins | Wins | Paid back |
|---|---|---|
| 1,000,000 | 23.0% | 96.9% (95.9% without the one jackpot) |
| 100,000,000 | 23.0% | 95.3% |
| Exact math | 22.95% | 95.30% |
Over 100,000,000 spins it landed on 95.3%, exactly the paytable.
Hot and cold slot machines: the next-spin test
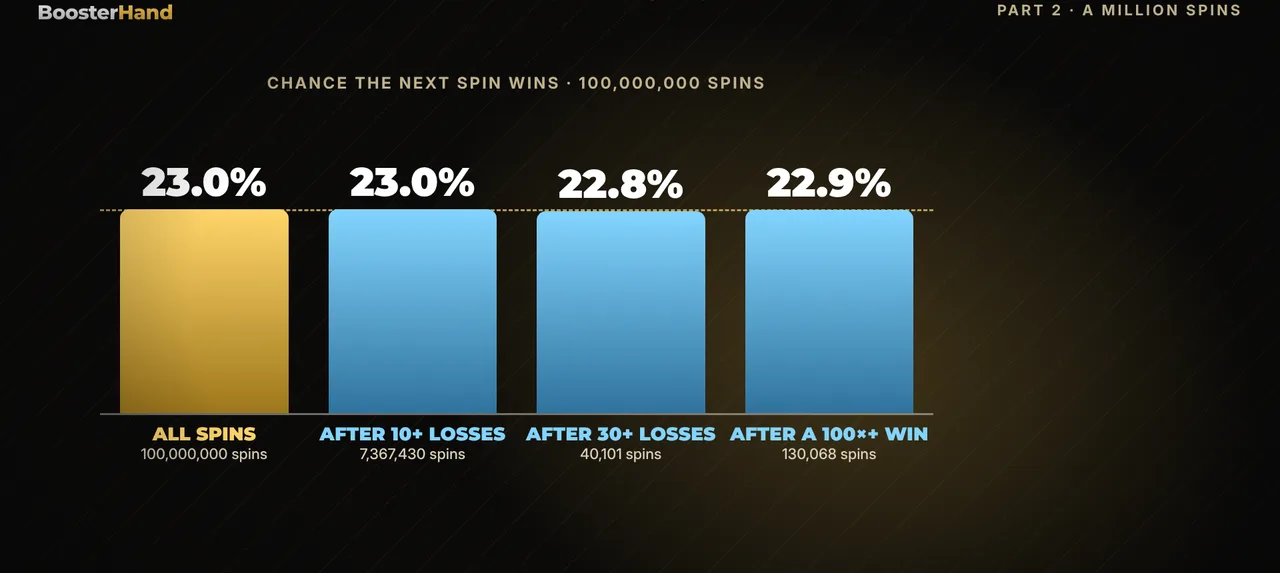
If machines ran hot or cold, the chance of a win would change after a losing streak or after a big win. Here’s what 100,000,000 spins showed:
| Before the spin | Spins tested | Next spin won |
|---|---|---|
| Anything (all spins) | 100,000,000 | 22.95% |
| 5+ losses in a row | 27,151,817 | 22.96% |
| 10+ losses in a row | 7,367,430 | 22.97% |
| 20+ losses in a row | 542,520 | 22.94% |
| 30+ losses in a row | 40,101 | 22.76% |
| A win of 100x or more | 130,068 | 22.87% |
Every row matches the exact 22.95% within normal random wobble (the 30+ row has the fewest spins, so it wobbles most). The longest losing streak in 100,000,000 spins was 67. The machine has no memory.
Is a slot jackpot ever due?
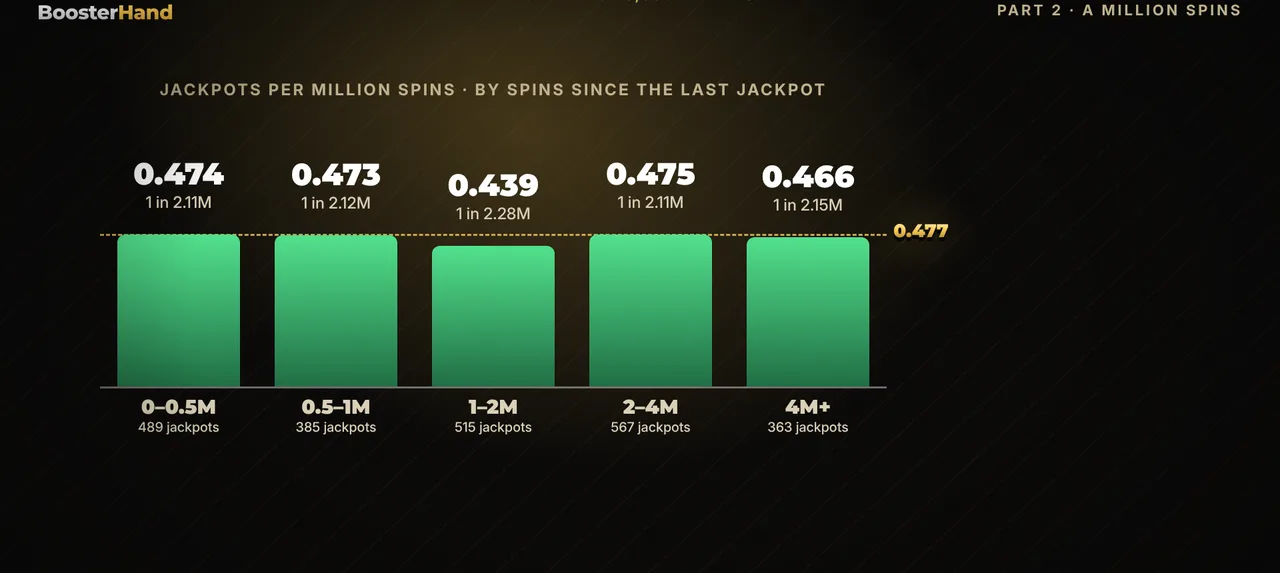
The jackpot is the real test, so I spun the machine 5,000,000,000 times. It hit 2,320 jackpots (the math expects about 2,384; the difference is normal for this many spins). Then I sorted every spin by how long it had been since the last jackpot:
| Spins since the last jackpot | Jackpots | Rate |
|---|---|---|
| 0–500,000 | 489 | 1 in 2.11 million |
| 500,000–1 million | 385 | 1 in 2.12 million |
| 1–2 million | 515 | 1 in 2.28 million |
| 2–4 million | 567 | 1 in 2.11 million |
| More than 4 million | 363 | 1 in 2.15 million |
Right after a jackpot, the next one came about once every 2.1 million spins. After 4 million dry spins: still about once every 2.1 million. Two jackpots landed just 21 spins apart, and the longest drought lasted 17,624,286 spins. A jackpot is never “due”; that’s the gambler’s fallacy applied to slots.
The heavy blanks next to the jackpot have one more effect: near misses. With 14 virtual stops each, a jackpot-jackpot-blank result with the third jackpot just off the line happens 28 times for every jackpot. With every stop equally likely it would be 2. We looked at this in detail in our near-miss simulation.
10,000 players: what a session looks like
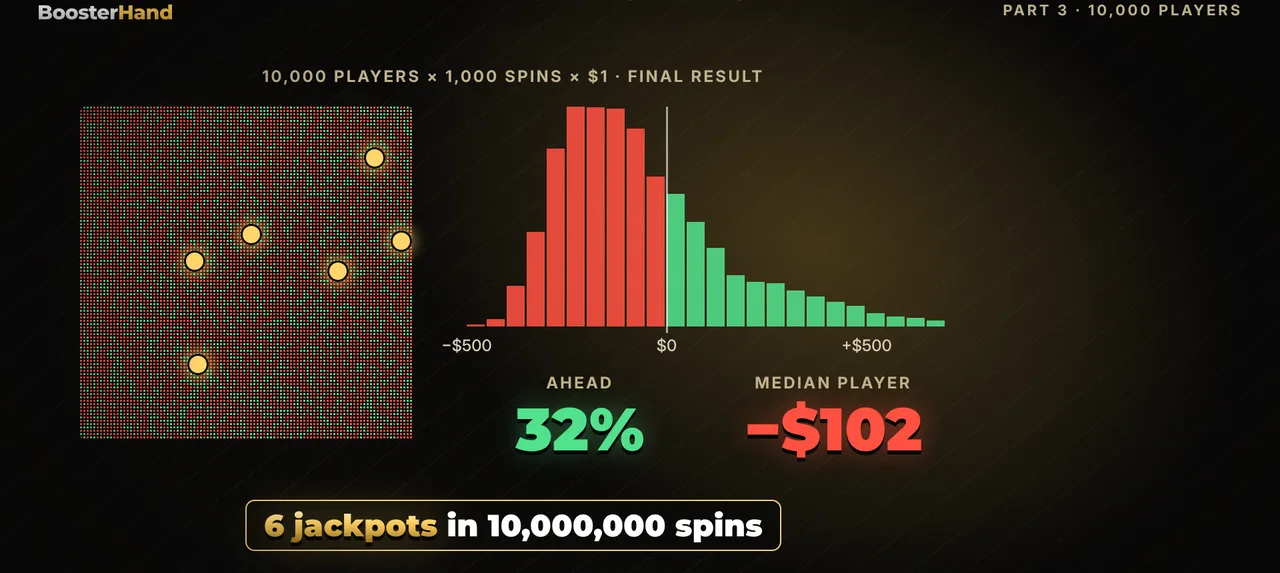
Finally I gave 10,000 players 1,000 spins of $1 each.
| Result | Value |
|---|---|
| Players who ended ahead | 32% |
| Median result | −$102 |
| Average result | −$46.57 |
| 10% of players did worse than | −$284.20 |
| 10% of players did better than | +$266 |
| Best player (hit the jackpot) | +$9,962 |
| Jackpots in 10,000,000 spins | 6 |
Almost a third of players walked away ahead, but the typical player lost $102, and only 6 of the 10,000,000 spins hit the jackpot. Almost nobody ever sees one, and the long tail of lucky sessions pulls the average (−$46.57) far above the median.
Limits of this model
This is a generic 3-reel, 1-line machine I built to show the mechanism. Real games use their own reels, weights, paylines and paytables, and modern video slots usually have many more symbols and lines, so their odds and RTP differ. What carries over is the math: if each spin is picked independently by an RNG, the reels you see don’t tell you the odds, and past spins don’t change the next one. Check each game’s info screen for its RTP.
What this means for you
- The reel you see isn’t the reel that’s weighted. Our jackpot looked like 1 stop in 22 but had 1 virtual stop in 128, so three of them were 1 in 2,097,152, not 1 in 10,648.
- There are no hot, cold or due machines. After 10+ losses, after a 100x win, or after 4 million spins without a jackpot, the odds of the next spin stayed the same.
- The RTP is fixed by the paytable and the hidden weights. Here 95.3%: you lose about 4.7 cents per dollar on average, and how long you’ve been playing doesn’t change it.
A slot machine is a game of pure chance with the edge built in. Set a budget you can afford to lose, and stop when it’s gone; our bankroll calculator shows how long a budget lasts. If gambling stops being fun, our responsible gambling page has tools and support.
So: due, cold or no change? And for what the same 95–96% looks like in a real session, see RTP explained: what 96% really means for your $100.
FAQ
How do slot machines work?
On every spin a random number generator picks a stop on each reel independently. In our model each reel has 22 visible stops, but the RNG picks one of 128 virtual stops that are mapped onto them. The spinning animation only shows a result that was already decided when the spin started.
What is a virtual reel on a slot machine?
A virtual reel is a hidden list of stops that the RNG actually picks from. Several virtual stops can point to the same symbol you see. In our machine the jackpot symbol has 1 of 128 virtual stops (0.78%) even though it looks like 1 of 22 (4.5%), and each blank next to it has 14 (10.9%).
Can a slot machine be hot, cold or due?
Not when every spin is independent. Over 100,000,000 simulated spins the next spin won 23.0% of the time overall, 23.0% after 10 or more losses in a row and 22.9% right after a 100x+ win. Over 5,000,000,000 spins the jackpot rate stayed about 1 in 2.1 million no matter how long since the last jackpot.
What are the odds of hitting a slot jackpot?
It depends on the hidden reels, not on what you see. In our 3-reel machine three jackpot symbols look like 1 in 10,648 (22 × 22 × 22) but are really 1 in 2,097,152 (128 × 128 × 128). Real games have their own reels, so the odds differ from game to game.
How is a slot machine's RTP calculated?
Multiply every payout by its exact probability and add them up. In our machine that gives 95.3%: the single-cherry win alone contributes 39.84% and the $10,000 jackpot only 0.48%. A simulation of 100,000,000 spins returned 95.3%, matching the math.
Related
Simulations use generic models, not any real game or casino. Results show long-run math, not predictions for one session. 18+ only. If gambling stops being fun, take a break: responsible gambling.
Sources
- Slot machine — Wikipedia
- Random number generation — Wikipedia
- Gambler's fallacy — Wikipedia
- Expected value — Wikipedia
Next experiment: House Edge Explained: 1,000,000 Slot Spins, Where the Money Went